Greater Vancouver · neighbourhood guide
Burnaby
Four town centres, two SkyTrain lines, and every housing type.
Overview
Living in Burnaby
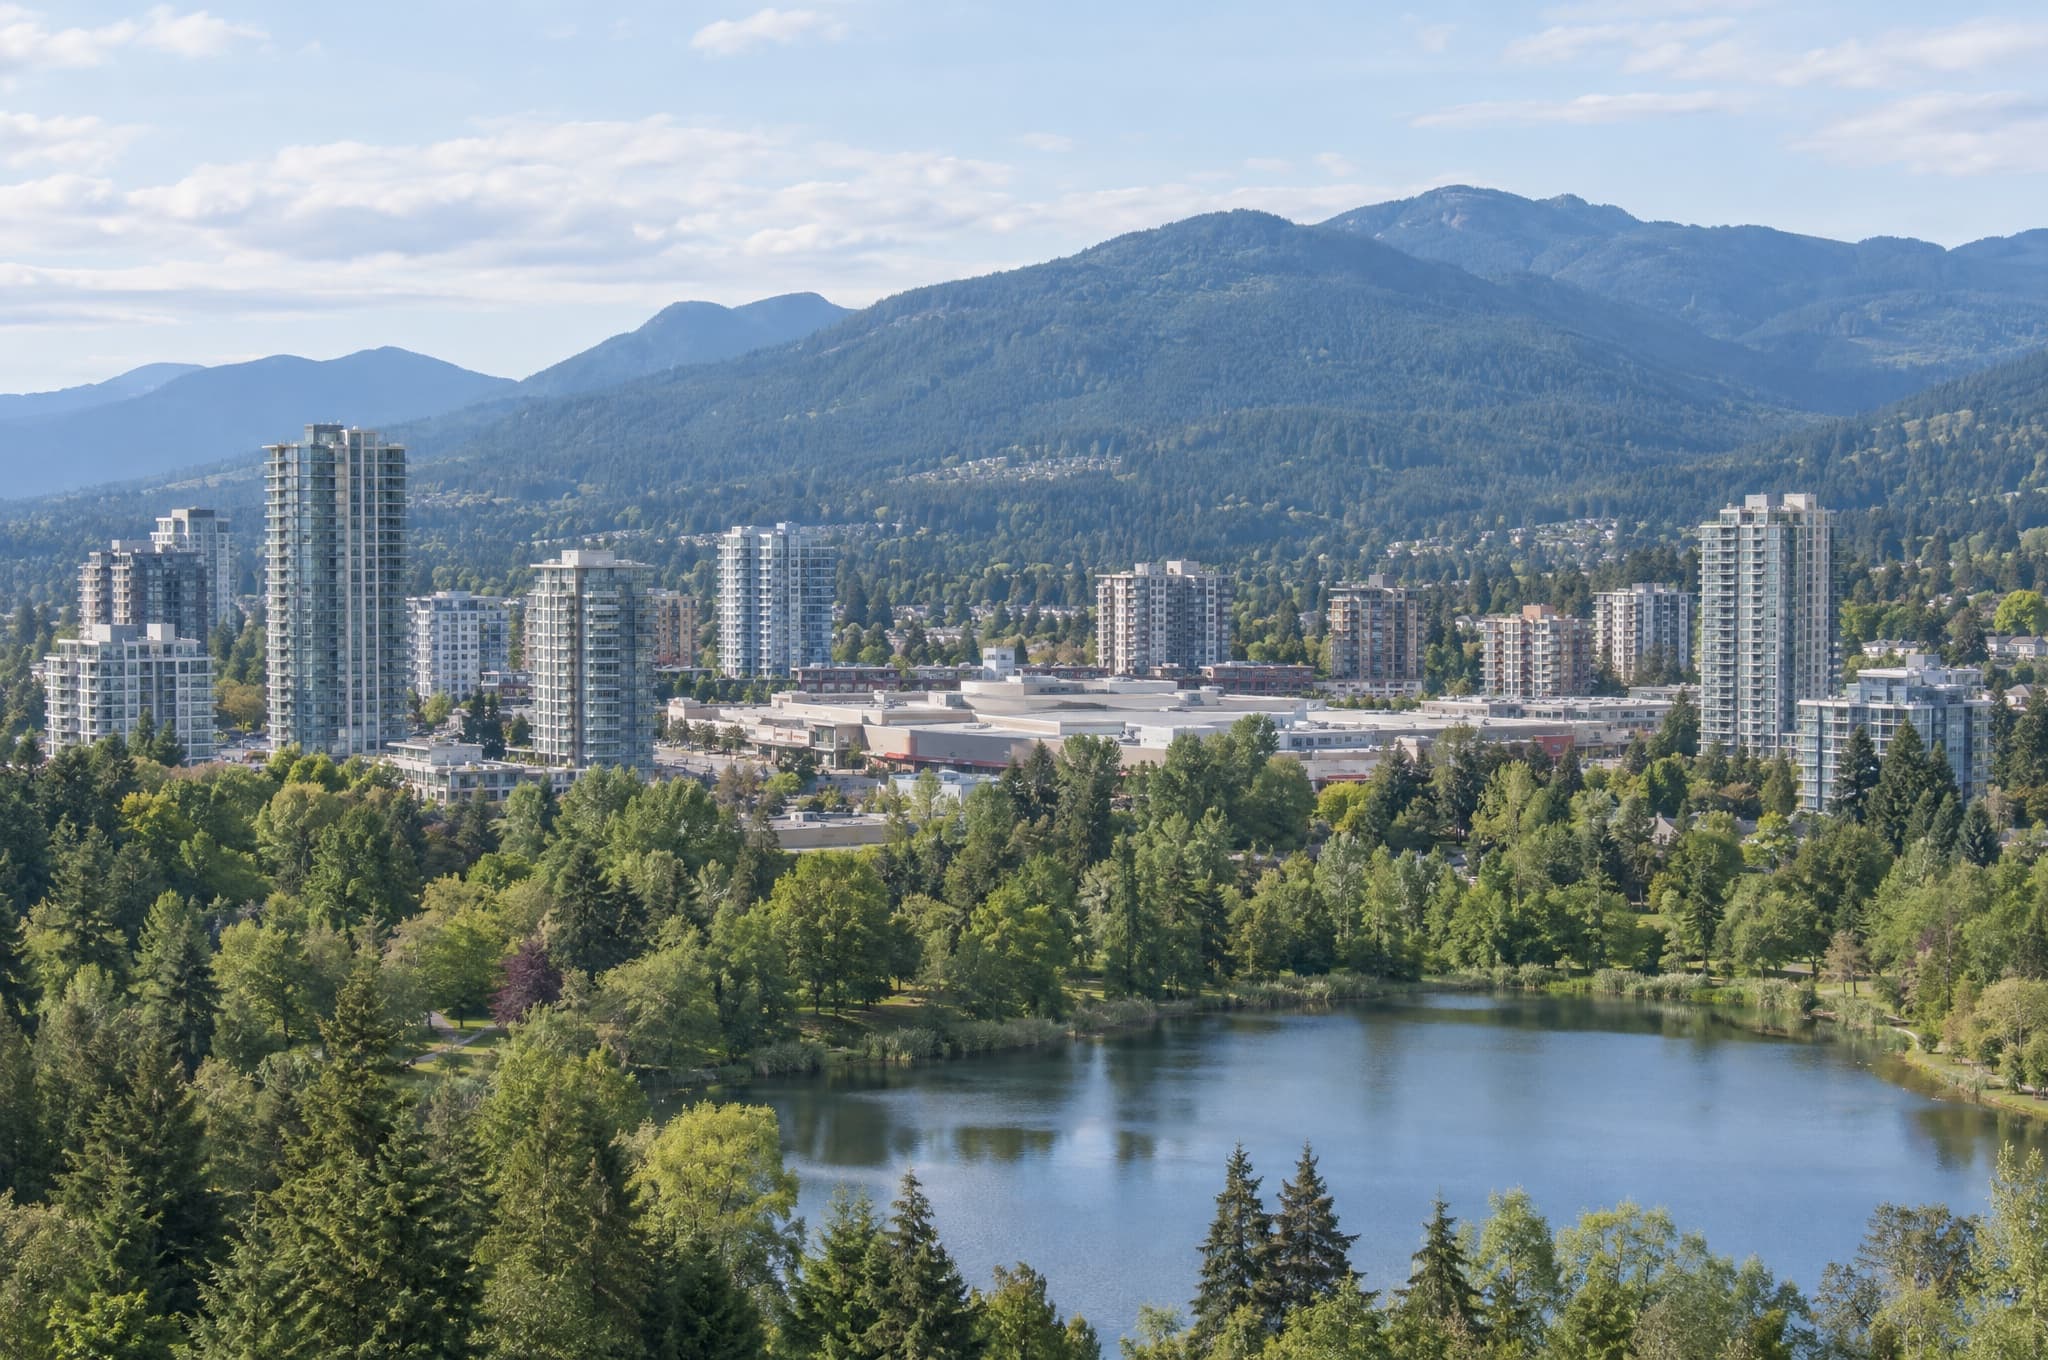
Burnaby is organised around Metrotown, Brentwood, Lougheed and Edmonds, each a dense transit hub surrounded by established single-family neighbourhoods such as Burnaby Heights, Deer Lake, Buckingham and the Big Bend.
The essentials
What shapes the market here.
Housing stock
Concrete high-rises at the town centres, townhomes and low-rise in between, and a wide range of detached from post-war bungalows to new builds on large lots.
Transit
Expo and Millennium Lines, with stations at Metrotown, Brentwood, Lougheed, Edmonds and more. Among the best-connected cities in the region.
Lifestyle
Deer Lake Park, Burnaby Mountain and SFU, Central Park, Burnaby Lake, Metropolis at Metrotown and the restaurants of the Heights and Crystal Mall.
Schools
Burnaby School District (SD41), with French immersion and specialty programs. Catchments vary by block.
Real estate in Burnaby
Working with Merv in Burnaby.
Mervin Truong is a licensed real estate advisor with RE/MAX 2000 Realty and a member of Candid Real Estate Group, helping people buy, sell and invest in Burnaby and across Greater Vancouver and the Fraser Valley. Every plan starts with how buyers are responding to comparable homes nearby.
Office
Mervin Truong Personal Real Estate Corporation
Candid Real Estate Group · RE/MAX 2000 Realty
15127 100 Ave #103
Surrey, BC V3R 0N9
Office 604-583-2000
Direct 778-885-9433
hello@mervintruong.ca
Market snapshot · September 2026
Burnaby by the numbers.
Last month’s sales, listings and prices by home type, with thirteen months of context. Updated monthly from the board data.
Burnaby
Detached houses · September 2026
Buyers have room to negotiate in Burnaby. About 11 of every 100 listings sold, and homes sold 4% under asking on average.
11%
Buyers’ market
Sales ratio: sales as a share of active listings this month.
- Sale price
- $1,825,000
- No change vs Aug
- Price per sq ft
- $662
- No change vs Aug
- Days on market
- 37
- ▼ 3% vs Aug
- Sale-to-list
- 96%
- ▲ 5% vs Aug
- Active listings
- 458
- ▼ 1% vs Aug
- Sales
- 50
- ▲ 19% vs Aug
View as table
| Month | Sale price | Detail |
|---|---|---|
| Sep 2025 | $1,987,500 | 48 sales · 472 listings |
| Oct 2025 | $1,878,000 | 53 sales · 457 listings |
| Nov 2025 | $1,897,500 | 36 sales · 415 listings |
| Dec 2025 | $1,992,500 | 40 sales · 303 listings |
| Jan 2026 | $1,852,500 | 30 sales · 336 listings |
| Feb 2026 | $1,860,000 | 36 sales · 352 listings |
| Mar 2026 | $1,966,500 | 34 sales · 387 listings |
| Apr 2026 | $1,839,000 | 52 sales · 430 listings |
| May 2026 | $1,970,000 | 41 sales · 476 listings |
| Jun 2026 | $1,750,000 | 57 sales · 477 listings |
| Jul 2026 | $1,816,250 | 50 sales · 459 listings |
| Aug 2026 | $1,820,000 | 42 sales · 461 listings |
| Sep 2026 | $1,825,000 | 50 sales · 458 listings |
View as table
| Month | Sales ratio | Detail |
|---|---|---|
| Sep 2025 | 10% | 48 sales of 472 listings |
| Oct 2025 | 12% | 53 sales of 457 listings |
| Nov 2025 | 9% | 36 sales of 415 listings |
| Dec 2025 | 13% | 40 sales of 303 listings |
| Jan 2026 | 9% | 30 sales of 336 listings |
| Feb 2026 | 10% | 36 sales of 352 listings |
| Mar 2026 | 9% | 34 sales of 387 listings |
| Apr 2026 | 12% | 52 sales of 430 listings |
| May 2026 | 9% | 41 sales of 476 listings |
| Jun 2026 | 12% | 57 sales of 477 listings |
| Jul 2026 | 11% | 50 sales of 459 listings |
| Aug 2026 | 9% | 42 sales of 461 listings |
| Sep 2026 | 11% | 50 sales of 458 listings |
By community
Most competitive: Metrotown (50%) · Most choice: Sperling-Duthie (4%)
| Community | Listings | Sales | Sales ratio |
|---|---|---|---|
| Capitol Hill | 40 | 3 | 8% |
| South Slope | 34 | 5 | 15% |
| Sperling-Duthie | 28 | 1 | 4% |
| East Burnaby | 26 | 2 | 8% |
| Parkcrest | 25 | 3 | 12% |
| Government Road | 24 | 0 | n/a |
| Brentwood Park | 21 | 3 | 14% |
| Montecito | 20 | 2 | 10% |
Competitive and choice readings need at least 10 listings; ratios above 100% mean last month’s sales exceeded this month’s listings.
Source: SnapStats® (snap-stats.com), compiled from Fraser Valley Real Estate Board and Greater Vancouver REALTORS® MLS® data captured October 1, 2026. Figures cover September 2026 versus the previous month. Accuracy and completeness are not guaranteed by the source; not intended to solicit properties already listed for sale.
FAQ
Questions buyers ask about Burnaby.
Each has a different age profile and amenity mix. Metrotown is the most established, Brentwood the fastest-changing. The building and strata matter more than the neighbourhood name.
Yes, particularly in South Burnaby and the Lougheed area. Zoning changes are also opening up more multi-unit options on single-family lots.
Burnaby Heights has a walkable commercial strip along Hastings and views over the inlet, which carries a premium relative to pockets further south.
About Burnaby
Ask a specific question.
Which streets, which buildings, which schools, and what a realistic budget buys. I answer with current data.
Nearby guides