Greater Vancouver · neighbourhood guide
Vancouver
From Downtown and the West Side to the East Side, one city with a dozen distinct markets.
Overview
Living in Vancouver
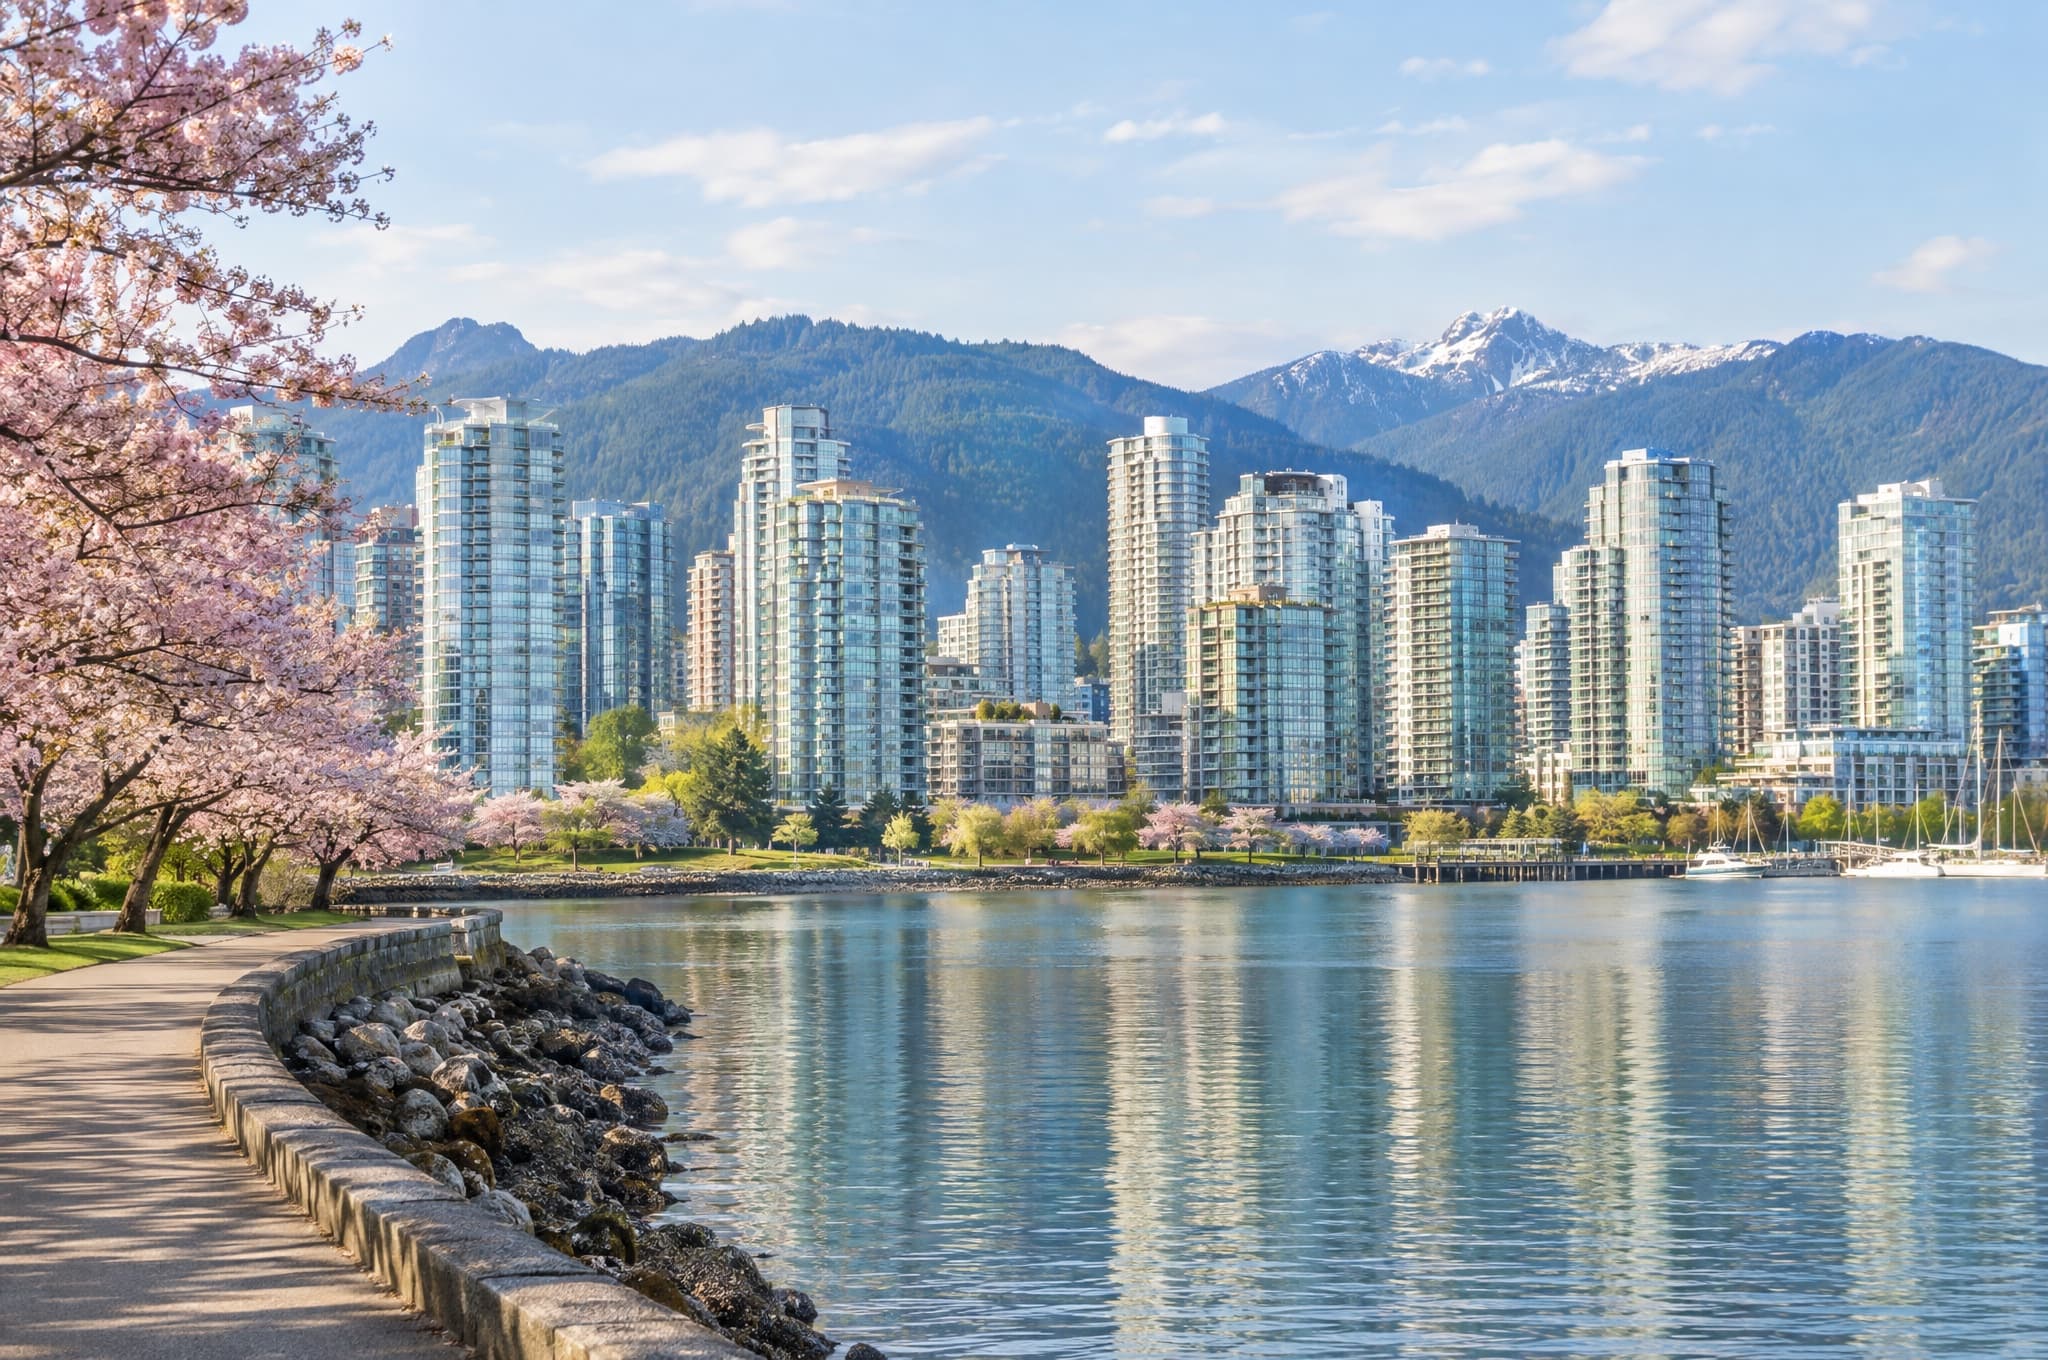
Vancouver runs from the glass towers of Downtown, Coal Harbour and Yaletown, through the West Side's Kitsilano, Point Grey and Dunbar, to the character neighbourhoods of the East Side: Mount Pleasant, Fraser, Hastings-Sunrise and Killarney. Each pocket prices and trades differently, and knowing those differences is what turns a city-wide search into a targeted one.
The essentials
What shapes the market here.
Housing stock
Concrete and wood-frame condos Downtown and along the Cambie and Broadway corridors; pre-war and mid-century character homes, many with suites or laneway houses, across the East and West Sides; new townhomes and multiplexes as single-family lots are rezoned.
Transit
Expo, Millennium and Canada Lines, the Broadway Subway extension underway, and frequent bus corridors on Main, Fraser, Kingsway, Hastings, Commercial Drive, Broadway and 4th. Seawall and bike routes make much of the city car-optional.
Lifestyle
Stanley Park and the seawall, Kitsilano and Jericho beaches, Commercial Drive, Main Street, Granville Island, Queen Elizabeth Park, Trout Lake, and the region's densest independent food scene.
Schools
Vancouver School Board (SD39), with French immersion and mini-school programs. Catchments vary block to block; confirm for any address.
Real estate in Vancouver
Working with Merv in Vancouver.
Mervin Truong is a licensed real estate advisor with RE/MAX 2000 Realty and a member of Candid Real Estate Group, helping people buy, sell and invest in Vancouver and across Greater Vancouver and the Fraser Valley. Every plan starts with how buyers are responding to comparable homes nearby.
Office
Mervin Truong Personal Real Estate Corporation
Candid Real Estate Group · RE/MAX 2000 Realty
15127 100 Ave #103
Surrey, BC V3R 0N9
Office 604-583-2000
Direct 778-885-9433
hello@mervintruong.ca
Market snapshot · September 2026
Vancouver by the numbers.
Last month’s sales, listings and prices by home type, with thirteen months of context. Updated monthly from the board data.
Condos & townhomes · September 2026
Neither side has a clear edge in Vancouver Downtown. About 12 of every 100 listings sold, and homes sold 4% under asking on average.
12%
Balanced market
Sales ratio: sales as a share of active listings this month.
- Sale price
- $733,750
- ▼ 18% vs Aug
- Price per sq ft
- $923
- ▼ 9% vs Aug
- Days on market
- 31
- ▲ 24% vs Aug
- Sale-to-list
- 96%
- ▼ 4% vs Aug
- Active listings
- 965
- ▲ 5% vs Aug
- Sales
- 114
- ▲ 1% vs Aug
View as table
| Month | Sale price | Detail |
|---|---|---|
| Sep 2025 | $827,500 | 126 sales · 1,140 listings |
| Oct 2025 | $745,000 | 141 sales · 1,114 listings |
| Nov 2025 | $797,000 | 140 sales · 1,049 listings |
| Dec 2025 | $680,000 | 115 sales · 758 listings |
| Jan 2026 | $733,750 | 72 sales · 822 listings |
| Feb 2026 | $773,750 | 116 sales · 881 listings |
| Mar 2026 | $769,000 | 140 sales · 916 listings |
| Apr 2026 | $768,000 | 133 sales · 1,012 listings |
| May 2026 | $787,500 | 120 sales · 1,033 listings |
| Jun 2026 | $890,000 | 143 sales · 975 listings |
| Jul 2026 | $805,000 | 134 sales · 917 listings |
| Aug 2026 | $895,000 | 113 sales · 922 listings |
| Sep 2026 | $733,750 | 114 sales · 965 listings |
View as table
| Month | Sales ratio | Detail |
|---|---|---|
| Sep 2025 | 11% | 126 sales of 1,140 listings |
| Oct 2025 | 13% | 141 sales of 1,114 listings |
| Nov 2025 | 13% | 140 sales of 1,049 listings |
| Dec 2025 | 15% | 115 sales of 758 listings |
| Jan 2026 | 9% | 72 sales of 822 listings |
| Feb 2026 | 13% | 116 sales of 881 listings |
| Mar 2026 | 15% | 140 sales of 916 listings |
| Apr 2026 | 13% | 133 sales of 1,012 listings |
| May 2026 | 12% | 120 sales of 1,033 listings |
| Jun 2026 | 15% | 143 sales of 975 listings |
| Jul 2026 | 15% | 134 sales of 917 listings |
| Aug 2026 | 12% | 113 sales of 922 listings |
| Sep 2026 | 12% | 114 sales of 965 listings |
By community
Most competitive: Westend (15%) · Most choice: Coal Harbour (8%)
| Community | Listings | Sales | Sales ratio |
|---|---|---|---|
| Downtown | 377 | 38 | 10% |
| Westend | 242 | 37 | 15% |
| Yaletown | 240 | 31 | 13% |
| Coal Harbour | 106 | 8 | 8% |
Competitive and choice readings need at least 10 listings; ratios above 100% mean last month’s sales exceeded this month’s listings.
Source: SnapStats® (snap-stats.com), compiled from Fraser Valley Real Estate Board and Greater Vancouver REALTORS® MLS® data captured October 1, 2026. Figures cover September 2026 versus the previous month. Accuracy and completeness are not guaranteed by the source; not intended to solicit properties already listed for sale.
FAQ
Questions buyers ask about Vancouver.
Downtown buys walkability, views and liquidity in a deep condo market; the East Side buys land, a suite and more space per dollar. Which is better depends on holding period and how you will live. I'll model both for you.
Rental income, flexibility for family, and resale appeal. Confirm permits, construction quality and how the income affects your financing.
Most single-family lots can now support several units, which affects land value and what redevelopment looks like on a given street. I assess each lot's potential and what it means for value.
Generally, values step down moving east and south from Main Street. Renfrew, Killarney and parts of Hastings-Sunrise often offer more house for the budget, and older concrete condos east of Cambie trade below the Downtown core.
About Vancouver
Ask a specific question.
Which streets, which buildings, which schools, and what a realistic budget buys. I answer with current data.
Nearby guides